Historical Research
Historical Research on CTAR Bands
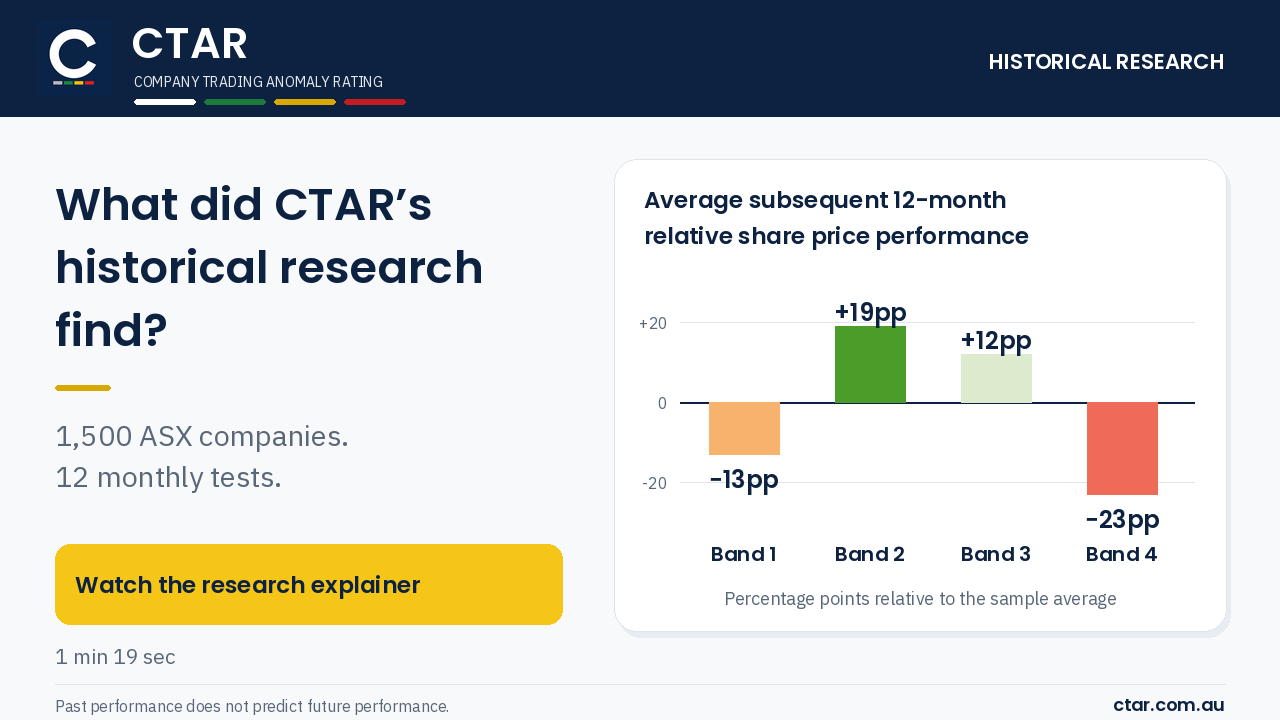
Based on approximately 1,500 ASX companies outside the ASX 300. For each of the twelve months sampled, companies were classified by their calculated CTAR Band, with the average subsequent 12-month relative share price performance measured.
HISTORICAL RESEARCH (Video Explainer)
Historical Research
Summarised Findings
- Band 4 recorded materially weaker average subsequent 12-month relative share price performance
- Band 2 recorded the highest average subsequent 12-month relative share price performance
- Higher Bands recorded more frequent severe losses (a subsequent 12-month return of −50% or worse)
Average subsequent 12-month relative share price performance by CTAR Band
← Lower unusual activityHigher unusual activity →
- Best performing Band
- Second best
- Third best
- Worst performing Band
Month by month
Relative 12-month share price performance for each classification month, by CTAR Band. The results represent twelve separate monthly classification cohorts.
| Performance Period(classification month) | Aug-24 – Jul-25(Jul-24) | Sep-24 – Aug-25(Aug-24) | Oct-24 – Sep-25(Sep-24) | Nov-24 – Oct-25(Oct-24) | Dec-24 – Nov-25(Nov-24) | Jan-25 – Dec-25(Dec-24) | Feb-25 – Jan-26(Jan-25) | Mar-25 – Feb-26(Feb-25) | Apr-25 – Mar-26(Mar-25) | May-25 – Apr-26(Apr-25) | Jun-25 – May-26(May-25) | Jul-25 – Jun-26(Jun-25) | Average | Best(months) | Worst(months) |
|---|---|---|---|---|---|---|---|---|---|---|---|---|---|---|---|
| Band 1 | Third best | Third best | Third best | Worst performing Band | Third best | Third best | Worst performing Band | Third best | Worst performing Band | Second best | Third best | Worst performing Band | −13pp | 0 | 4 |
| Band 2 | Best performing Band | Best performing Band | Best performing Band | Third best | Second best | Best performing Band | Second best | Best performing Band | Second best | Best performing Band | Second best | Best performing Band | +19pp | 7 | 0 |
| Band 3 | Second best | Second best | Second best | Best performing Band | Best performing Band | Second best | Best performing Band | Second best | Best performing Band | Third best | Best performing Band | Third best | +12pp | 5 | 0 |
| Band 4 | Worst performing Band | Worst performing Band | Worst performing Band | Second best | Worst performing Band | Worst performing Band | Third best | Worst performing Band | Third best | Worst performing Band | Worst performing Band | Second best | −23pp | 0 | 8 |
- Best performing Band
- Second best
- Third best
- Worst performing Band
Based on approximately 1,500 ASX companies outside the ASX 300. Figures are relative to all companies measured, and cell colours rank the four Bands against each other within each month, from best to worst. Best and Worst count the months in which each Band ranked first or last. Individual company outcomes varied, and historical results may not be repeated. Refer to Research methodology below.
Risk and breadth of returns
How often companies in each CTAR Band recorded a severe share price loss over the subsequent 12 months, and how many companies rose compared with fell.
Severe loss (≤ −50% return) rate by CTAR Band
← Lower unusual activityHigher unusual activity →
Positive : negative return ratio by CTAR Band
← Lower unusual activityHigher unusual activity →
1.00 = equal numbers of companies with positive and negative returns
Research methodology
Companies were classified separately each month from July 2024 to June 2025. Each monthly group’s subsequent 12-month share price performance was measured using its original membership (12 separate cohorts from August 2024 – July 2025 to July 2025 – June 2026). Companies could receive different classifications in later months.
The anomalies, weights and Band thresholds were defined before examining subsequent share price performance. The same methodology has continued into subsequent periods. Further analysis compared CTAR Bands within groups of similarly sized companies (market capitalisation comparison). The results broadly supported the historical findings.
Return calculation
Performance measures the percentage change between closing share prices at the start and end of the relevant period. Historical prices account for share splits and consolidations where applicable. Dividends are excluded, with the figures representing price performance rather than total shareholder return. Companies are equally weighted within each monthly cohort. The twelve monthly cohort results are then equally weighted when calculating the overall average for each Band.
Severe loss rate
For each monthly cohort, the severe loss rate is the share of a Band’s companies whose subsequent 12-month share price return was −50% or worse.
Positive : negative ratio
The positive : negative ratio is the number of a Band’s companies with a positive subsequent 12-month share price return divided by the number with a negative return. A return of exactly 0% counts as neither. The figures shown are the averages of the twelve monthly figures.
Universe and period
- Approximately 1,500 ASX-listed companies outside the ASX 300.
- Band 1 – 4 company distributions approximated 55%, 35%, 7% and 3%.
- Twelve monthly classification cohorts from July 2024 to June 2025. Each cohort measured over the subsequent 12 months against all companies in that cohort.
Limitations
- The monthly observation periods overlap and should not be treated as twelve independent tests.
- Companies without the required price information are excluded, including affected delisted, acquired or suspended companies. The findings relate to companies with full, available information.
- Band 4 contains relatively few companies, particularly in some months, making its averages more sensitive to individual company outcomes.
- Historical results describe groups of companies. Individual outcomes varied, and the observed patterns may not persist in other periods.
- Past performance does not predict future performance.